Category: Engineering

  • Continuous Integration on the Web

    Continuous Integration on the Web

    Continuous Integration (sometimes shortened to CI) is an important and useful practice in modern software development that focuses on integrating code changes into a shared repository frequently. This practice allows teams to detect and address errors quickly, improving the quality and stability of a project. This is a modern standard that eliminates lots of risk on regular code deployments into a production environment.

    What is CI?

    At its core, CI involves automating the process of testing and integrating new code. When a developer pushes changes to a repository, CI tools automatically validate the new code against the existing codebase through predefined tests. This ensures that the codebase remains functional and reduces the risk of introducing bugs.

    In web development, where multiple team members work on various features simultaneously, CI acts as a safety net, catching potential integration issues early. This is especially critical when developing responsive websites or complex applications where a single error can cascade into larger problems.


    How CI Works in Web Development

    1. Code Changes: Developers write and commit their code locally.
    2. Push to Repository: The code is pushed to a shared repository, like GitHub, GitLab, or Bitbucket.
    3. Automated Build: The CI pipeline kicks in, building the application or project to verify that it compiles correctly.
    4. Automated Tests: Predefined tests (unit tests, integration tests, and sometimes end-to-end tests) are executed to ensure the new changes don’t break existing functionality.
    5. Feedback: The CI tool provides feedback, often in the form of success or failure notifications. Developers can address any issues before the code is merged.
    6. Deployments (Optional): Some setups integrate Continuous Deployment (CD), automatically deploying changes to staging or production environments after successful CI checks.

    Getting Started with CI

    To implement CI in your web development workflow:

    1. Choose a CI Tool: Popular options include Jenkins, CircleCI, GitHub Actions, GitLab CI/CD, and Travis CI.
    2. Set Up Your Repository: Use Git to version-control your project. A hosted service like GitHub simplifies integration with CI tools.
    3. Automate Testing: Write tests using frameworks like Jest, Mocha, or Cypress. This ensures that your CI pipeline can validate code changes effectively.
    4. Iterate and Improve: Monitor the pipeline’s performance and add additional checks or optimizations as your project evolves.

    Create a CI Configuration File: Most CI tools require a configuration file (e.g., .yml or .json) in your project’s root directory to define the pipeline. For example, with GitHub Actions:

    name: CI Pipeline
    on: [push, pull_request]
    jobs:
      build:
        runs-on: ubuntu-latest
        steps:
          - name: Checkout Code
            uses: actions/checkout@v3
          - name: Install Dependencies
            run: npm install
          - name: Run Tests
            run: npm test
    

    Why CI Matters

    Adopting CI in web development workflows enhances collaboration, speeds up development cycles, and ensures higher-quality code. It allows teams to deliver robust websites and applications with confidence, staying agile in today’s fast-paced tech landscape.

  • Debugging tips

    Debugging tips

    Debugging is a critical skill for any engineer. The ability to track down elusive bugs can elevate you from a good developer to a great one. I was lucky enough to spend time evaluating lots of different levels of programmers code when I was learning programming and working at a community college.

    In this post, I’ll share strategies I’ve honed over years of tackling stubborn issues in complex environments. Let’s dive into how to debug effectively and save yourself (and your team) hours of frustration.


    1. Start with a Hypothesis

    Every bug is a puzzle, and every puzzle needs a theory. Before diving into the code, spend a moment to think critically.

    • Ask questions: What were you expecting, and what went wrong? What has changed recently?
    • Check assumptions: Are you sure the environment, data, or tools are configured correctly?

    Writing down a hypothesis helps narrow your focus and keeps you grounded when the problem starts to sprawl.


    2. Reproduce the bug

    Before you can solve a bug, you’ve gotta make it happen again. A reproducible bug is halfway solved.

    • Use controlled inputs: Minimize variables by isolating specific data or user actions. “What were you doing when this happened?”
    • Automate reproduction: If the bug requires complex steps, write a quick script or use browser dev tools to automate it. Automation may sometimes be too complex to replicate, but even writing the steps that lead to the bug can give some clues or insights into what may be happening.

    Document the steps clearly so others can reproduce it, too.


    3. Leverage Your Debugging Toolkit

    Modern frontend development offers powerful tools for pinpointing problems. Make sure you’re using them effectively:

    • Browser DevTools: Set breakpoints, inspect network requests, or analyze performance metrics.
    • Source Maps: Translate minified or compiled code back to the original source for easier debugging.
    • Logging: Everyones favorite. Insert console logs at key points to track variables and execution flow.

    4. Divide and Conquer

    When the issue seems overwhelming, break it into smaller pieces.

    • Comment out sections: Temporarily remove chunks of code to see if the bug persists.
    • Binary search: Gradually narrow the scope of the problem, working from broad to specific. When presented with a large amount of areas the issue can come from (possibly a WordPress plug-in) you can remove half of the suspects to narrow down which “chunk” the issue is coming from. When you determine which “chunk” the issue exists in, you can break that chunk into half again.

    The goal is to locate the exact line or set of lines where things go wrong.


    5. Consider the Unusual Suspects

    Not every bug originates in your code. Common culprits include:

    • Third-party dependencies: A package update might have introduced breaking changes.
    • Environment issues: Browser-specific quirks, mismatched Node versions, or corrupted caches.
    • Timing problems: Async functions, race conditions, or unexpected re-renders in React.

    Look beyond the obvious to uncover hidden issues.


    6. Document and Reflect

    Once you’ve fixed the bug, take the time to document it for future reference.

    • Write a detailed postmortem: Include the root cause, steps to reproduce, and how it was resolved.
    • Update team knowledge: Share findings in a team meeting or post it to your internal documentation hub.
    • Reflect on prevention: Could a test, linter rule, or process improvement have caught this earlier?

    This practice not only helps you grow as a developer but also elevates your team’s collective proficiency.


    Final Thoughts

    Debugging is an art that requires patience, persistence, and practice. By approaching problems methodically and using the right tools, you can break through even the toughest debugging barriers. Remember, every bug you solve makes you better prepared for the next challenge.

    Take regular breaks if issues are persistent, sometimes your approach needs to be changed. A pomodoro timer is a great way to make sure you’re not digging deep holes in the wrong direction.

    Do you have favorite debugging techniques that I might have missed?

  • Using Github to display Github Pages

    Using Github to display Github Pages

    GitHub Pages is a free and user-friendly way to host websites directly from your GitHub repository. Whether you’re showcasing a portfolio, documentation, or a blog, GitHub Pages makes it simple to publish your project.


    What is GitHub Pages?

    GitHub Pages is a static site hosting service integrated with GitHub. It takes files from a branch in your repository, runs them through a build process (if needed), and publishes them as a website. You can use this with your own purchased domain name or utilize the github.io URL that they provide you.


    Setting Up GitHub Pages

    1. Create or Select a Repository:
      • Log in to your GitHub account and create a new repository or use an existing one.
      • Ensure your files are ready for the web (e.g., HTML, CSS, JS).
    2. Enable GitHub Pages:
      • Go to the repository’s Settings.
      • Navigate to the Pages section.
      • Select the branch to use for your site (e.g., main or gh-pages). Optionally, set a folder like /root or /docs for source files.
      • Click Save.
    3. Access Your Site:
      • After a few moments, your site will be live at:
        https://<username>.github.io/<repository-name>/

    Adding Content

    • Simple Static Files: Place index.html in the root of your repository for a basic static site.
    • Jekyll Support: Use Jekyll, a static site generator, to add blogs or themes. GitHub Pages automatically processes Jekyll sites.
      • Add a _config.yml file for customization.
    • Markdown Support: Write .md files, and Jekyll will render them as HTML.

    Advanced Features

    1. Custom Domains:
      • Set up a custom domain by adding your domain in the Pages settings.
      • Add a CNAME file to your repository with your domain name.
    2. SSL Certificates:
      GitHub Pages automatically provides HTTPS for secure browsing.
    3. GitHub Actions for Automation:
      Automate builds or deploy processes with custom GitHub Actions workflows.

    Common Issues and Debugging

    1. 404 Errors:
      • Check if index.html exists in the root directory.
      • Verify the correct branch and folder in the Pages settings.
    2. Jekyll Build Errors:
      • Review error logs provided in the GitHub Pages build section.
      • Disable Jekyll processing by adding an empty .nojekyll file.
    3. Delayed Updates:
      • Changes may take a few minutes to propagate. Clear your browser cache if updates aren’t visible. Evaluate after waiting a couple minutes if you’re not immediately seeing changes.
    4. Custom Domain Errors:
      • Ensure DNS records are properly configured (e.g., A records for GitHub’s IPs or a CNAME pointing to username.github.io).

    Why Use GitHub Pages?

    • Free Hosting: Perfect for personal projects or small websites.
    • Easy Deployment: Push changes to your repository, and GitHub takes care of the rest.
    • Community Support: Leverage GitHub’s massive community for advice and resources.

    GitHub Pages is a fantastic tool for hosting static websites effortlessly. With just a repository and a few configuration steps, you can create and deploy a professional-looking site in minutes.

  • Debugging Google Ads with Google Publisher Console

    Debugging Google Ads with Google Publisher Console

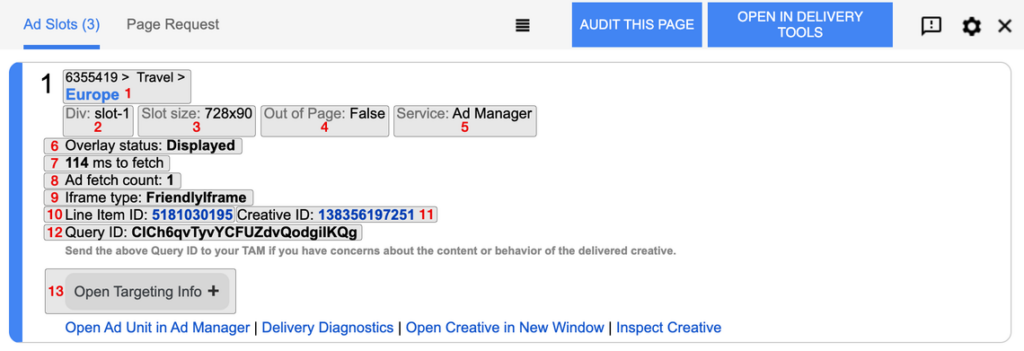
    Google Ads provides several debugging tools, and one of the incredibly effective techniques is simply appending the google_console=1 query parameter to your URL. This enables detailed logs in your browser console, making it easier to diagnose and fix issues with ad scripts, tracking tags, or conversions.

    What is google_console=1?

    Adding google_console=1 to your URL activates verbose logging for Google Ads scripts. It’s particularly useful for debugging issues like:

    • Misfiring conversion tags.
    • Incorrect or missing parameter values.
    • Validation errors in dynamic remarketing tags.

    How to Use It

    1. Enable the Debug Mode:
      Simply append ?google_console=1 to your URL. If there are already query parameters in the URL, append &google_console=1.
      • Example:
        https://example.com/landing-page?google_console=1
    2. Open Your Browser Console:
      Access the console in your browser’s Developer Tools (e.g., Ctrl + Shift + J in Chrome). You’ll see logs generated by Google Ads scripts, including errors, warnings, and informational messages.

    What to Look For

    Once activated, the console will provide detailed logs for all Google Ads activity on the page. Here are some key things to watch:

    1. Tag Firing Events:
      Look for messages like:
      Google Ads: Conversion tag fired
      This confirms the tag is working as expected.
    2. Parameter Validation:
      Logs will indicate whether required parameters (e.g., conversion_value, transaction_id) are being passed. Missing or incorrect values will trigger warnings.
    3. Remarketing Tag Debugging:
      If you’re using dynamic remarketing, the console will validate attributes and provide feedback if any are missing or improperly formatted.
    4. Errors or Warnings:
      Pay attention to:
      • “No HTTP response detected”: Indicates a tag isn’t firing correctly.
      • “Parameter mismatch”: Suggests issues with dynamic values.

    Key Benefits of google_console=1

    • Detailed Feedback: Get precise messages about what’s working and what’s not.
    • Real-Time Validation: Understand tag and parameter behavior instantly.
    • Simplified Debugging: Eliminate the guesswork for dynamic or custom scripts.

    The google_console=1 query parameter is an underutilized but powerful tool for debugging Google Ads setups. By enabling verbose logs, you can quickly identify and resolve issues, ensuring your campaigns track and perform as expected.

    Read More from the official developers.google.com:
    https://developers.google.com/publisher-tag/guides/publisher-console