Tag: Engineering

  • Getting Started with TensorFlow.js – Real-Time Object Detection

    Getting Started with TensorFlow.js – Real-Time Object Detection

    Ever wondered how object detection works in web applications? With TensorFlow.js, you can leverage pre-trained models to build powerful machine learning applications directly in the browser. In this guide, I’ll walk you through creating a real-time object detection app using TensorFlow.js and the pre-trained Coco-SSD model. This project is beginner-friendly and perfect for exploring the potential of TensorFlow.js.

    What are we building?

    A web-based app that:

    • Accesses your webcam feed.
    • Uses a pre-trained object detection model (Coco-SSD).
    • Displays detected objects in real-time with bounding boxes and labels.

    What is needed?

    • A modern web browser (e.g., Chrome, Edge).
    • Basic JavaScript knowledge.
    • A text editor (vscode or similar) and web server (or just open the HTML file locally).

    The Markup

    Here’s the markup that the code will live in. Minimal styling needed, including our assets for tensorflow.js and coco-ssd, and finally your script.js file where the action lives.

    <!DOCTYPE html>
    <html lang="en">
    <head>
        <meta charset="UTF-8">
        <title>TensorFlow Object Detection</title>
        <style>
            body, html {
                margin: 0;
                padding: 0;
                height: 100%;
                overflow: hidden;
            }
    
            canvas {
                position: absolute;
                left: 0;
            }
        </style>
    
        <script src="https://cdn.jsdelivr.net/npm/@tensorflow/tfjs"></script>
        <script src="https://cdn.jsdelivr.net/npm/@tensorflow-models/coco-ssd"></script>
        <script src="script.js">  </script>
    
    </head>
    <body>
        <h1>TensorFlow Object Detection</h1>
    </body>
    </html>
    

    The script

    Here’s the full script we’ll use for object detection. Let’s break it into sections to understand what each part does.

    window.onload = async () => {
      // 1. Create and set up the video element
      const video = document.createElement('video');
      video.width = 640;
      video.height = 480;
      document.body.appendChild(video);
    
      // 2. Create and set up the canvas element
      const canvas = document.createElement('canvas');
      canvas.width = 640;
      canvas.height = 480;
      document.body.appendChild(canvas);
      const ctx = canvas.getContext('2d');
    
      // 3. Access the webcam
      try {
        const stream = await navigator.mediaDevices.getUserMedia({ video: true });
        video.srcObject = stream;
        await video.play();
      } catch (error) {
        console.error('Error accessing the webcam:', error);
        return;
      }
    
      // 4. Load the pre-trained Coco-SSD model
      const model = await cocoSsd.load();
      console.log('Coco-SSD model loaded!');
    
      // 5. Define a function to draw predictions
      function drawPredictions(predictions) {
        ctx.clearRect(0, 0, canvas.width, canvas.height);
        predictions.forEach((prediction) => {
          const [x, y, width, height] = prediction.bbox;
          ctx.strokeStyle = 'red';
          ctx.lineWidth = 2;
          ctx.strokeRect(x, y, width, height);
          ctx.font = '18px Arial';
          ctx.fillStyle = 'red';
          ctx.fillText(
            `${prediction.class} (${Math.round(prediction.score * 100)}%)`,
            x,
            y > 10 ? y - 5 : 10
          );
        });
      }
    
      // 6. Detect objects and draw predictions in a loop
      async function detectAndDraw() {
        const predictions = await model.detect(video);
        drawPredictions(predictions);
        requestAnimationFrame(detectAndDraw);
      }
    
      // Start the detection loop
      detectAndDraw();
    };
    

    The Breakdown

    1. Set Up the Video and Canvas Elements
      • The video element is used to display the webcam feed.
      • The canvas element acts as an overlay to draw bounding boxes and labels for detected objects. The ctx variable provides a 2D drawing context for the canvas.
    2. Access the Webcam
      • The navigator.mediaDevices.getUserMedia API requests access to the webcam. If successful, the webcam feed is set as the srcObject of the video element.
      • If access is denied or an error occurs, the error is logged to the console.
    3. Load the Coco-SSD Model
      • The cocoSsd.load() function loads the pre-trained object detection model. This model recognizes over 90 object classes, including people, cars, animals, and more.
    4. Draw Predictions
      • The drawPredictions function loops through each detected object and:
        • Draws a bounding box around the detected object.
        • Displays the object’s label and confidence score as text.
    5. Detect and Draw in Real-Time
      • The detectAndDraw function runs the model’s detect method on the video feed to get predictions.
      • It calls drawPredictions to update the canvas with the latest results.
      • The requestAnimationFrame method ensures the detection loop runs smoothly and continuously.

    What’s Happening?

    This project combines TensorFlow.js’s machine learning capabilities with the browser’s native APIs for video and drawing. It’s a lightweight and powerful demonstration of AI in the browser, without requiring any server-side processing.

    Building a real-time object detection app is a rewarding way to get started with TensorFlow.js. This breakdown helps you understand how all the pieces fit together, making it easier to expand or adapt for future projects.

    Further reading:

    References and Resources

    1. TensorFlow.js Documentation
    2. Web APIs
  • Building an Isometric Babylon.js Game: An early Project Scaffold

    Building an Isometric Babylon.js Game: An early Project Scaffold

    In this post, we’ll walk through a simple project scaffold for creating an isometric game using Babylon.js. This scaffold sets up the core elements required to get started with your game development—from initializing the rendering engine to basic player movement.

    Include Babylon.js and its dependencies

    <script src="https://cdn.babylonjs.com/babylon.js"></script>
    <script src="https://cdn.babylonjs.com/loaders/babylonjs.loaders.min.js"></script>
    <script src="https://code.jquery.com/pep/0.4.3/pep.js"></script>
    

    Setting Up the Canvas

    The project begins with an HTML canvas element to serve as the rendering target for Babylon.js:

    <canvas id="renderCanvas" touch-action="none"></canvas>

    This canvas is referenced in the JavaScript code to initialize the Babylon.js engine and render the scene. The touch-action attribute is set to “none” to improve touch interaction on mobile devices.

    Some initial styling may be appropriate to add as a default here:

    body, html {
      margin: 0;
      padding: 0;
      height: 100%;
      overflow: hidden;
    }
    
    #renderCanvas {
      width: 100%;
      height: 100%;
      touch-action: none;
    }

    Game Configuration

    Configuration values, like player speed and camera sensitivity, are centralized in a GameConfig object. This simplifies adjustments and allows you to toggle features like debug mode:

    const GameConfig = {
        PLAYER_SPEED: 0.1,
        CAMERA_SENSITIVITY: 0.5,
        WORLD_SCALE: 1,
        DEBUG_MODE: true
    };

    Main Game Class

    The HDTwoDGame class encapsulates all the major systems:

    class HDTwoDGame {
        constructor() {
            this.canvas = document.getElementById("renderCanvas");
            this.engine = null;
            this.scene = null;
            this.camera = null;
            this.player = null;
    
            this.initEngine();
            this.createScene();
            this.setupControls();
            this.setupRendering();
        }
    }

    This object-oriented approach makes the code modular and easier to extend as your game evolves.

    Initializing the Engine

    The initEngine method creates the Babylon.js engine, links it to the canvas, and ensures responsiveness by resizing the engine on window resize events:

    initEngine() {
        this.engine = new BABYLON.Engine(this.canvas, true, {
            preserveDrawingBuffer: true,
            stencil: true
        });
    
        window.addEventListener('resize', () => {
            this.engine.resize();
        });
    }

    Building the Scene

    The createScene method defines the core elements of the game world, including the camera, lighting, and basic geometry:

    Camera Setup

    An isometric-like perspective is achieved using an ArcRotateCamera:

    this.camera = new BABYLON.ArcRotateCamera(
        "MainCamera",
        -Math.PI / 4,  // Horizontal angle
        Math.PI / 4,   // Vertical angle
        10,            // Radius
        new BABYLON.Vector3(0, 0, 0),
        this.scene
    );
    this.camera.attachControl(this.canvas, true);

    Lighting and Geometry

    Soft ambient lighting and a simple ground plane create a minimalistic environment:

    const hemisphericLight = new BABYLON.HemisphericLight(
        "light",
        new BABYLON.Vector3(0, 1, 0),
        this.scene
    );
    hemisphericLight.intensity = 0.7;
    
    const ground = BABYLON.MeshBuilder.CreateGround(
        "ground",
        {width: 10, height: 10},
        this.scene
    );

    Player Placeholder

    A basic box represents the player character:

    this.player = BABYLON.MeshBuilder.CreateBox(
        "player",
        {size: 1},
        this.scene
    );
    this.player.position.y = 0.5;  // Elevate above ground

    Setting Up Controls

    Keyboard controls allow the player to move using WASD keys. The setupControls method listens for keyboard events:

    setupControls() {
        this.scene.onKeyboardObservable.add((kbInfo) => {
            if (kbInfo.type === BABYLON.KeyboardEventTypes.KEYDOWN) {
                this.handleKeyDown(kbInfo.event);
            }
        });
    }
    
    handleKeyDown(evt) {
        const speed = GameConfig.PLAYER_SPEED;
        switch(evt.key.toLowerCase()) {
            case 'w': this.player.position.z -= speed; break; // Forward
            case 's': this.player.position.z += speed; break; // Backward
            case 'a': this.player.position.x -= speed; break; // Left
            case 'd': this.player.position.x += speed; break; // Right
        }
    }

    Rendering the Scene

    The setupRendering method defines the game loop. It updates the camera’s target to follow the player and renders the scene:

    setupRendering() {
        this.engine.runRenderLoop(() => {
            this.camera.target = this.player.position;
            this.scene.render();
        });
    }

    Debugging and Future Extensions

    With GameConfig.DEBUG_MODE enabled, the Babylon.js debug layer can be toggled:

    if (GameConfig.DEBUG_MODE) {
        this.scene.debugLayer.show();
    }

    Conclusion

    This scaffold provides a solid foundation for building a Babylon.js game. It handles essential tasks like engine initialization, scene creation, input handling, and rendering. With these basics in place, you can focus on adding features, improving visuals, and implementing game mechanics.

  • During holiday break I discovered TouchDesigner

    During holiday break I discovered TouchDesigner

    TouchDesigner is a powerful visual programming tool designed for real-time interactive multimedia applications. Developed by Derivative, it is widely used by artists, designers, and engineers to create stunning visualizations, interactive installations, and dynamic audio-visual performances. Its node-based interface makes it accessible for both beginners and professionals, offering flexibility and scalability for projects of all sizes.

    What Makes TouchDesigner Unique?

    Unlike traditional programming environments, TouchDesigner focuses on visual workflows. Users can manipulate nodes—each representing a specific function or operation—to create complex systems without needing extensive coding knowledge. However, for those who enjoy scripting, TouchDesigner integrates Python for deeper customization and control.

    What Can You Do With TouchDesigner?

    TouchDesigner is incredibly versatile. Here are some of the ways it’s used:

    • Interactive Installations: Design reactive environments that respond to user movements, touch, or other inputs.
    • Live Performances: Build real-time visuals for concerts, theater, or dance performances.
    • Projection Mapping: Map visuals onto irregular surfaces, bringing sculptures, buildings, or objects to life.
    • Data Visualization: Create immersive and dynamic ways to explore and represent data.
    • Generative Art: Experiment with algorithmic patterns and designs.
    • Virtual Production: Craft virtual sets and environments for films and video projects.

    Why Use TouchDesigner?

    TouchDesigner excels at real-time applications, making it perfect for projects requiring responsive visuals or interaction. Whether you’re creating an experimental art piece or a professional-grade installation, its flexibility and robust feature set ensure it can handle the task.

    If you’re curious about blending technology, art, and interaction, TouchDesigner is a playground worth exploring. Its community is thriving, offering countless tutorials and resources to help you get started.

    Learn more at https://derivative.ca/learn

  • Web Development in 2024: A Year in Review

    Web Development in 2024: A Year in Review

    2024 reshaped web development with AI-powered tools streamlining workflows, React Server Components becoming a mainstream standard, and a critical focus on performance and sustainability. Developers leaned into TypeScript, edge computing, and eco-conscious practices to build smarter, faster, and greener applications. These trends set the stage for 2025 to prioritize accessible, adaptive, and high-performing web solutions.

    AI Integration Becomes Mainstream

    The most significant shift in 2024 was the seamless integration of AI into frontend development workflows. Developers increasingly used AI-powered coding assistants not just for code completion, but for entire component generation, design suggestions, and performance optimization. Frameworks started baking in AI-assisted development tools directly into their core offerings. Tools like GitHub Copilot, ChatGPT, and Figma AI bridged gaps between development and design, revolutionizing workflows.


    React Server Components Go Fully Mainstream

    After years of gradual adoption, React Server Components became a standard approach for building performant web applications. Developers embraced the pattern of mixing server-side rendering with client-side interactivity, leading to significant improvements in initial load times and overall application performance. This shift aligned with broader trends toward server-driven UI approaches.


    Web Performance Took Center Stage

    Performance optimization moved from a nice-to-have to a critical requirement. Tools like Lighthouse and performance-first frameworks gained tremendous traction. Developers focused on:

    • Minimal JavaScript bundles
    • Efficient server-side rendering
    • Advanced lazy loading techniques
    • Web vitals as a core metric for success

    The rise of edge computing, with platforms like Cloudflare Workers and Vercel Edge Middleware, further emphasized the importance of bringing compute closer to users.


    TypeScript Continues Its Dominance

    TypeScript solidified its position as the de facto standard for type-safe JavaScript development. More frameworks and libraries provided first-class TypeScript support, making type safety an expected feature rather than an optional add-on. This trend reduced runtime errors and improved developer experience.


    2024 saw a continued focus on:

    • Micro-interactions and delightful user experiences
    • Accessibility-first design
    • Dark mode as a standard feature
    • More responsive and adaptive interfaces

    Additionally, the resurgence of web animations, powered by tools like Lottie and Framer Motion, made UX more engaging and intuitive.


    Web Assembly (WASM) Gains Significant Ground

    Web Assembly continued its march towards becoming a critical technology for high-performance web applications, especially in areas like:

    • Complex calculations
    • Graphics rendering
    • Machine learning in the browser
    • Gaming and multimedia applications

    Sustainability in Web Development

    Energy-efficient web development gained attention, with developers optimizing resource usage and reducing the carbon footprint of web apps. Tools like GreenFrame and Lighthouse’s Eco-Mode helped developers measure and reduce their applications’ environmental impact.


    Key Takeaways for 2025

    1. Embrace AI Tooling: Integration of AI into development workflows is no longer optional.
    2. Performance is Paramount: Optimize every aspect of web applications, from initial load to interaction.
    3. Type Safety Matters: Adopt TypeScript and strong typing across your projects.
    4. Modular and Adaptive Design: Create components and interfaces that are flexible and accessible.
    5. Leverage Edge Computing: Utilize edge platforms to bring faster, scalable experiences to users.
    6. Continuous Learning: The web development landscape continues to evolve rapidly, so stay curious and adaptable.

    The frontend landscape in 2024 was characterized by a focus on performance, developer experience, and intelligent tooling. Carrying these lessons into 2025 will ensure fast, accessible, and intelligent web experiences that meet the evolving demands of users and stakeholders.

  • Continuous Integration on the Web

    Continuous Integration on the Web

    Continuous Integration (sometimes shortened to CI) is an important and useful practice in modern software development that focuses on integrating code changes into a shared repository frequently. This practice allows teams to detect and address errors quickly, improving the quality and stability of a project. This is a modern standard that eliminates lots of risk on regular code deployments into a production environment.

    What is CI?

    At its core, CI involves automating the process of testing and integrating new code. When a developer pushes changes to a repository, CI tools automatically validate the new code against the existing codebase through predefined tests. This ensures that the codebase remains functional and reduces the risk of introducing bugs.

    In web development, where multiple team members work on various features simultaneously, CI acts as a safety net, catching potential integration issues early. This is especially critical when developing responsive websites or complex applications where a single error can cascade into larger problems.


    How CI Works in Web Development

    1. Code Changes: Developers write and commit their code locally.
    2. Push to Repository: The code is pushed to a shared repository, like GitHub, GitLab, or Bitbucket.
    3. Automated Build: The CI pipeline kicks in, building the application or project to verify that it compiles correctly.
    4. Automated Tests: Predefined tests (unit tests, integration tests, and sometimes end-to-end tests) are executed to ensure the new changes don’t break existing functionality.
    5. Feedback: The CI tool provides feedback, often in the form of success or failure notifications. Developers can address any issues before the code is merged.
    6. Deployments (Optional): Some setups integrate Continuous Deployment (CD), automatically deploying changes to staging or production environments after successful CI checks.

    Getting Started with CI

    To implement CI in your web development workflow:

    1. Choose a CI Tool: Popular options include Jenkins, CircleCI, GitHub Actions, GitLab CI/CD, and Travis CI.
    2. Set Up Your Repository: Use Git to version-control your project. A hosted service like GitHub simplifies integration with CI tools.
    3. Automate Testing: Write tests using frameworks like Jest, Mocha, or Cypress. This ensures that your CI pipeline can validate code changes effectively.
    4. Iterate and Improve: Monitor the pipeline’s performance and add additional checks or optimizations as your project evolves.

    Create a CI Configuration File: Most CI tools require a configuration file (e.g., .yml or .json) in your project’s root directory to define the pipeline. For example, with GitHub Actions:

    name: CI Pipeline
    on: [push, pull_request]
    jobs:
      build:
        runs-on: ubuntu-latest
        steps:
          - name: Checkout Code
            uses: actions/checkout@v3
          - name: Install Dependencies
            run: npm install
          - name: Run Tests
            run: npm test
    

    Why CI Matters

    Adopting CI in web development workflows enhances collaboration, speeds up development cycles, and ensures higher-quality code. It allows teams to deliver robust websites and applications with confidence, staying agile in today’s fast-paced tech landscape.

  • Debugging tips

    Debugging tips

    Debugging is a critical skill for any engineer. The ability to track down elusive bugs can elevate you from a good developer to a great one. I was lucky enough to spend time evaluating lots of different levels of programmers code when I was learning programming and working at a community college.

    In this post, I’ll share strategies I’ve honed over years of tackling stubborn issues in complex environments. Let’s dive into how to debug effectively and save yourself (and your team) hours of frustration.


    1. Start with a Hypothesis

    Every bug is a puzzle, and every puzzle needs a theory. Before diving into the code, spend a moment to think critically.

    • Ask questions: What were you expecting, and what went wrong? What has changed recently?
    • Check assumptions: Are you sure the environment, data, or tools are configured correctly?

    Writing down a hypothesis helps narrow your focus and keeps you grounded when the problem starts to sprawl.


    2. Reproduce the bug

    Before you can solve a bug, you’ve gotta make it happen again. A reproducible bug is halfway solved.

    • Use controlled inputs: Minimize variables by isolating specific data or user actions. “What were you doing when this happened?”
    • Automate reproduction: If the bug requires complex steps, write a quick script or use browser dev tools to automate it. Automation may sometimes be too complex to replicate, but even writing the steps that lead to the bug can give some clues or insights into what may be happening.

    Document the steps clearly so others can reproduce it, too.


    3. Leverage Your Debugging Toolkit

    Modern frontend development offers powerful tools for pinpointing problems. Make sure you’re using them effectively:

    • Browser DevTools: Set breakpoints, inspect network requests, or analyze performance metrics.
    • Source Maps: Translate minified or compiled code back to the original source for easier debugging.
    • Logging: Everyones favorite. Insert console logs at key points to track variables and execution flow.

    4. Divide and Conquer

    When the issue seems overwhelming, break it into smaller pieces.

    • Comment out sections: Temporarily remove chunks of code to see if the bug persists.
    • Binary search: Gradually narrow the scope of the problem, working from broad to specific. When presented with a large amount of areas the issue can come from (possibly a WordPress plug-in) you can remove half of the suspects to narrow down which “chunk” the issue is coming from. When you determine which “chunk” the issue exists in, you can break that chunk into half again.

    The goal is to locate the exact line or set of lines where things go wrong.


    5. Consider the Unusual Suspects

    Not every bug originates in your code. Common culprits include:

    • Third-party dependencies: A package update might have introduced breaking changes.
    • Environment issues: Browser-specific quirks, mismatched Node versions, or corrupted caches.
    • Timing problems: Async functions, race conditions, or unexpected re-renders in React.

    Look beyond the obvious to uncover hidden issues.


    6. Document and Reflect

    Once you’ve fixed the bug, take the time to document it for future reference.

    • Write a detailed postmortem: Include the root cause, steps to reproduce, and how it was resolved.
    • Update team knowledge: Share findings in a team meeting or post it to your internal documentation hub.
    • Reflect on prevention: Could a test, linter rule, or process improvement have caught this earlier?

    This practice not only helps you grow as a developer but also elevates your team’s collective proficiency.


    Final Thoughts

    Debugging is an art that requires patience, persistence, and practice. By approaching problems methodically and using the right tools, you can break through even the toughest debugging barriers. Remember, every bug you solve makes you better prepared for the next challenge.

    Take regular breaks if issues are persistent, sometimes your approach needs to be changed. A pomodoro timer is a great way to make sure you’re not digging deep holes in the wrong direction.

    Do you have favorite debugging techniques that I might have missed?

  • Using Github to display Github Pages

    Using Github to display Github Pages

    GitHub Pages is a free and user-friendly way to host websites directly from your GitHub repository. Whether you’re showcasing a portfolio, documentation, or a blog, GitHub Pages makes it simple to publish your project.


    What is GitHub Pages?

    GitHub Pages is a static site hosting service integrated with GitHub. It takes files from a branch in your repository, runs them through a build process (if needed), and publishes them as a website. You can use this with your own purchased domain name or utilize the github.io URL that they provide you.


    Setting Up GitHub Pages

    1. Create or Select a Repository:
      • Log in to your GitHub account and create a new repository or use an existing one.
      • Ensure your files are ready for the web (e.g., HTML, CSS, JS).
    2. Enable GitHub Pages:
      • Go to the repository’s Settings.
      • Navigate to the Pages section.
      • Select the branch to use for your site (e.g., main or gh-pages). Optionally, set a folder like /root or /docs for source files.
      • Click Save.
    3. Access Your Site:
      • After a few moments, your site will be live at:
        https://<username>.github.io/<repository-name>/

    Adding Content

    • Simple Static Files: Place index.html in the root of your repository for a basic static site.
    • Jekyll Support: Use Jekyll, a static site generator, to add blogs or themes. GitHub Pages automatically processes Jekyll sites.
      • Add a _config.yml file for customization.
    • Markdown Support: Write .md files, and Jekyll will render them as HTML.

    Advanced Features

    1. Custom Domains:
      • Set up a custom domain by adding your domain in the Pages settings.
      • Add a CNAME file to your repository with your domain name.
    2. SSL Certificates:
      GitHub Pages automatically provides HTTPS for secure browsing.
    3. GitHub Actions for Automation:
      Automate builds or deploy processes with custom GitHub Actions workflows.

    Common Issues and Debugging

    1. 404 Errors:
      • Check if index.html exists in the root directory.
      • Verify the correct branch and folder in the Pages settings.
    2. Jekyll Build Errors:
      • Review error logs provided in the GitHub Pages build section.
      • Disable Jekyll processing by adding an empty .nojekyll file.
    3. Delayed Updates:
      • Changes may take a few minutes to propagate. Clear your browser cache if updates aren’t visible. Evaluate after waiting a couple minutes if you’re not immediately seeing changes.
    4. Custom Domain Errors:
      • Ensure DNS records are properly configured (e.g., A records for GitHub’s IPs or a CNAME pointing to username.github.io).

    Why Use GitHub Pages?

    • Free Hosting: Perfect for personal projects or small websites.
    • Easy Deployment: Push changes to your repository, and GitHub takes care of the rest.
    • Community Support: Leverage GitHub’s massive community for advice and resources.

    GitHub Pages is a fantastic tool for hosting static websites effortlessly. With just a repository and a few configuration steps, you can create and deploy a professional-looking site in minutes.

  • Debugging Google Ads with Google Publisher Console

    Debugging Google Ads with Google Publisher Console

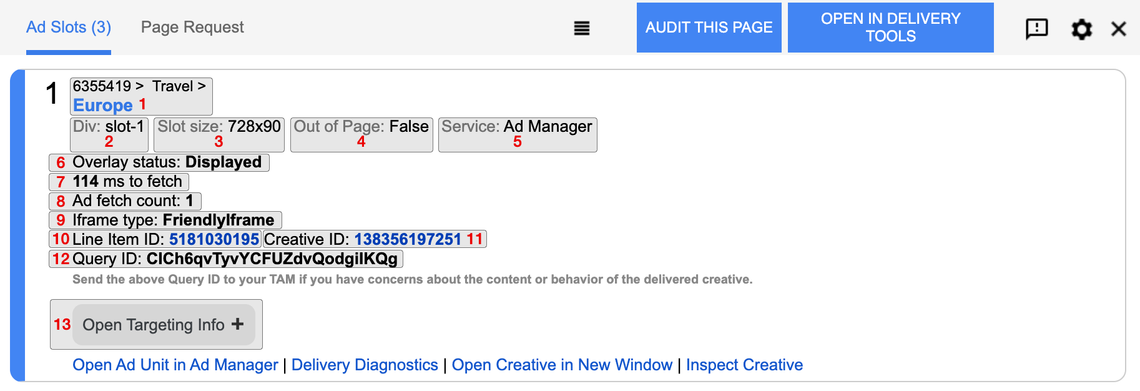
    Google Ads provides several debugging tools, and one of the incredibly effective techniques is simply appending the google_console=1 query parameter to your URL. This enables detailed logs in your browser console, making it easier to diagnose and fix issues with ad scripts, tracking tags, or conversions.

    What is google_console=1?

    Adding google_console=1 to your URL activates verbose logging for Google Ads scripts. It’s particularly useful for debugging issues like:

    • Misfiring conversion tags.
    • Incorrect or missing parameter values.
    • Validation errors in dynamic remarketing tags.

    How to Use It

    1. Enable the Debug Mode:
      Simply append ?google_console=1 to your URL. If there are already query parameters in the URL, append &google_console=1.
      • Example:
        https://example.com/landing-page?google_console=1
    2. Open Your Browser Console:
      Access the console in your browser’s Developer Tools (e.g., Ctrl + Shift + J in Chrome). You’ll see logs generated by Google Ads scripts, including errors, warnings, and informational messages.

    What to Look For

    Once activated, the console will provide detailed logs for all Google Ads activity on the page. Here are some key things to watch:

    1. Tag Firing Events:
      Look for messages like:
      Google Ads: Conversion tag fired
      This confirms the tag is working as expected.
    2. Parameter Validation:
      Logs will indicate whether required parameters (e.g., conversion_value, transaction_id) are being passed. Missing or incorrect values will trigger warnings.
    3. Remarketing Tag Debugging:
      If you’re using dynamic remarketing, the console will validate attributes and provide feedback if any are missing or improperly formatted.
    4. Errors or Warnings:
      Pay attention to:
      • “No HTTP response detected”: Indicates a tag isn’t firing correctly.
      • “Parameter mismatch”: Suggests issues with dynamic values.

    Key Benefits of google_console=1

    • Detailed Feedback: Get precise messages about what’s working and what’s not.
    • Real-Time Validation: Understand tag and parameter behavior instantly.
    • Simplified Debugging: Eliminate the guesswork for dynamic or custom scripts.

    The google_console=1 query parameter is an underutilized but powerful tool for debugging Google Ads setups. By enabling verbose logs, you can quickly identify and resolve issues, ensuring your campaigns track and perform as expected.

    Read More from the official developers.google.com:
    https://developers.google.com/publisher-tag/guides/publisher-console